-Visualize large collections of abstract data
Scientific visualization
-Representation of data with geometric structure

Visualization Concept
-Analyzing floods of data in tabular or textual form is tedious
-Humans must sequentially scan such data
-Visualization exploits the human's visual perceptive capabilities and parallel processing Size, Shape, Distance, and Color
-Easy to spot patterns and irregularities
Data types supported
-Ordinal
Has a sequence e.g. day of week
-Nominal
Has no sequence e.g. types of fishes
-Quantitative
Can be measured e.g. length, time, weight, temperature, speed
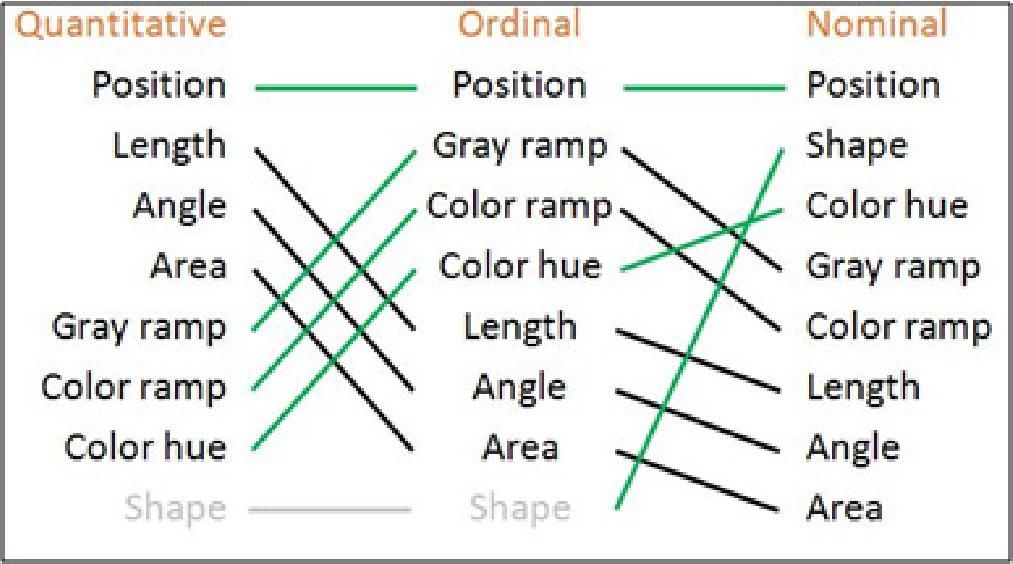
Visualization Effectiveness
-Each data type has its most effective way of visualization
Information Visualization Process

DAVIX Linux Distribution (http://davix.secviz.org/)
-Provide the audience with a workable and integrated tools set
-Enable them to immediately start with security visualization
-Motivate them to contribute to the security visualization community
Tools Available
Capture
-Network Tools (Argus, Snort, Wireshark)
-Logging (syslog-ng)
-Fetching Data (wget, ftp, scp)
Processing
-Shell Tools (awk, grep, sed)
-Visualization Preprocessing (AfterGlow, LGL)
-Extraction (Chaosreader)
-Data Enrichment (geoiplookup, whois, gwhois)
Visualization
-Network Traffic (EtherApe, InetVis, tnv)
-Generic (AfterGlow, Cytoscape, Graphviz, LGL Viewer, Mondrian, R Project, Treemap)
Interface Transport
-Each visualization tool has its own file format interfaces
-Data must be converted to match the import interfaces
-These adapters are mostly self-written snippets of code
Important Note:
All the images presented in this post are intellectual property of the copyright owner (www.secviz.org)


