Information visualization
-Visualize large collections of abstract data
Scientific visualization
-Representation of data with geometric structure
Visualization Concept
-Analyzing floods of data in tabular or textual form is tedious
-Humans must sequentially scan such data
-Visualization exploits the human's visual perceptive capabilities and parallel processing Size, Shape, Distance, and Color
-Easy to spot patterns and irregularities
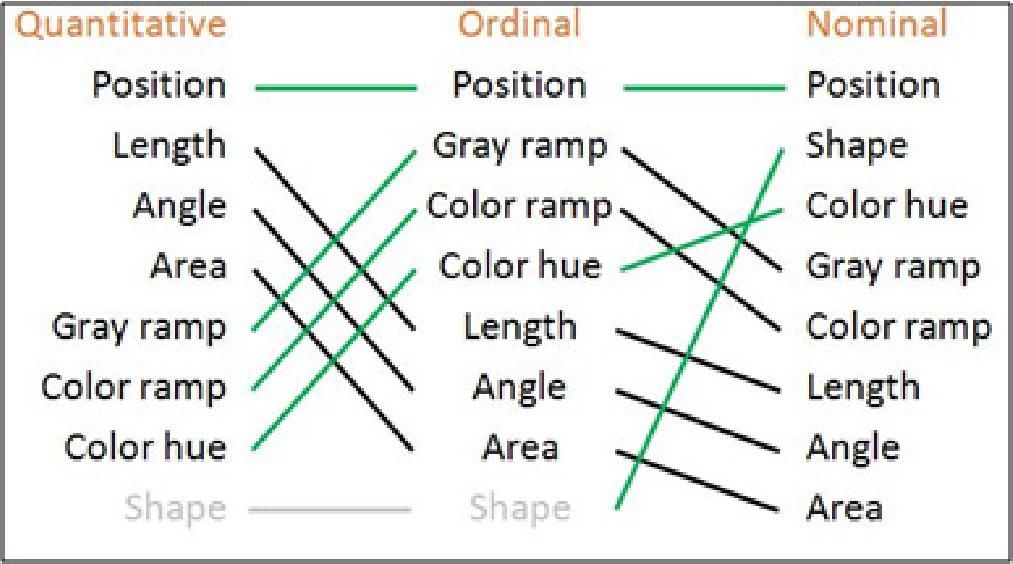
Data types supported
-Ordinal
Has a sequence e.g. day of week
-Nominal
Has no sequence e.g. types of fishes
-Quantitative
Can be measured e.g. length, time, weight, temperature, speed
Visualization Effectiveness
-Each data type has its most effective way of visualization
Information Visualization Process
DAVIX Linux Distribution (http://davix.secviz.org/)
-Provide the audience with a workable and integrated tools set
-Enable them to immediately start with security visualization
-Motivate them to contribute to the security visualization community
Tools Available
Capture
-Network Tools (Argus, Snort, Wireshark)
-Logging (syslog-ng)
-Fetching Data (wget, ftp, scp)
Processing
-Shell Tools (awk, grep, sed)
-Visualization Preprocessing (AfterGlow, LGL)
-Extraction (Chaosreader)
-Data Enrichment (geoiplookup, whois, gwhois)
Visualization
-Network Traffic (EtherApe, InetVis, tnv)
-Generic (AfterGlow, Cytoscape, Graphviz, LGL Viewer, Mondrian, R Project, Treemap)
Interface Transport
-Each visualization tool has its own file format interfaces
-Data must be converted to match the import interfaces
-These adapters are mostly self-written snippets of code
Important Note:
All the images presented in this post are intellectual property of the copyright owner (www.secviz.org)
Showing posts with label log visualization. Show all posts
Monday, August 2, 2010
Tuesday, June 30, 2009
Log Centralization, Analysis and Visualization
Although many of us have seen IT companies securing the logs in one centralized location but in one or two they lack visualization in time of incident handling or analysis process. This could raise a serious bar from legal and corporate image perspectives. SEIM (Security event information management) systems can help to resolve these issues but logging, correlation and visualizing from distributed networks has always been challanging.

As we can see that different souces interacting with muliple devices at specific levels to pass the network traffic. The ratio of such typical network to generate logs would be moderate-high. So, why is it log centralization is considered necessary? From my experience, it is because of easy accessibility, searchability, log categorization, identification, correlation and redundancy. While talking about securing architecture of log management, virtualization concepts put the step forward mostly in data centers and hosting farms. The typical architecture looks as below:
{Sources -> Generate Logs -> Virtualization (analyzing, disposing logs) -> Log Management (storing, analyzing logs)}
The typical challanges to this architecture involves balancing the quantity of log management resources, policies and procedures, continuous monitoring of log data, log categorization and access control. On the otherside when considering the visualization, DAVIX Live CD contains some of the useful tools and scripts which make it easier to process data and visualize them to track the incidents.
References:
http://davix.secviz.org
http://www.wallinfire.net/picviz
http://www.vizsec.org
http://www.splunk.com
Subscribe to:
Posts (Atom)


